Performance Analytics
Powered by Rosenberg Analytics
After every training day or regatta, your boat’s GPS and sensor data is turned into a clear, visual report by Rosenberg Analytics. It shows exactly where the team gains and loses, so debriefs are built on numbers rather than feel.
What each report covers
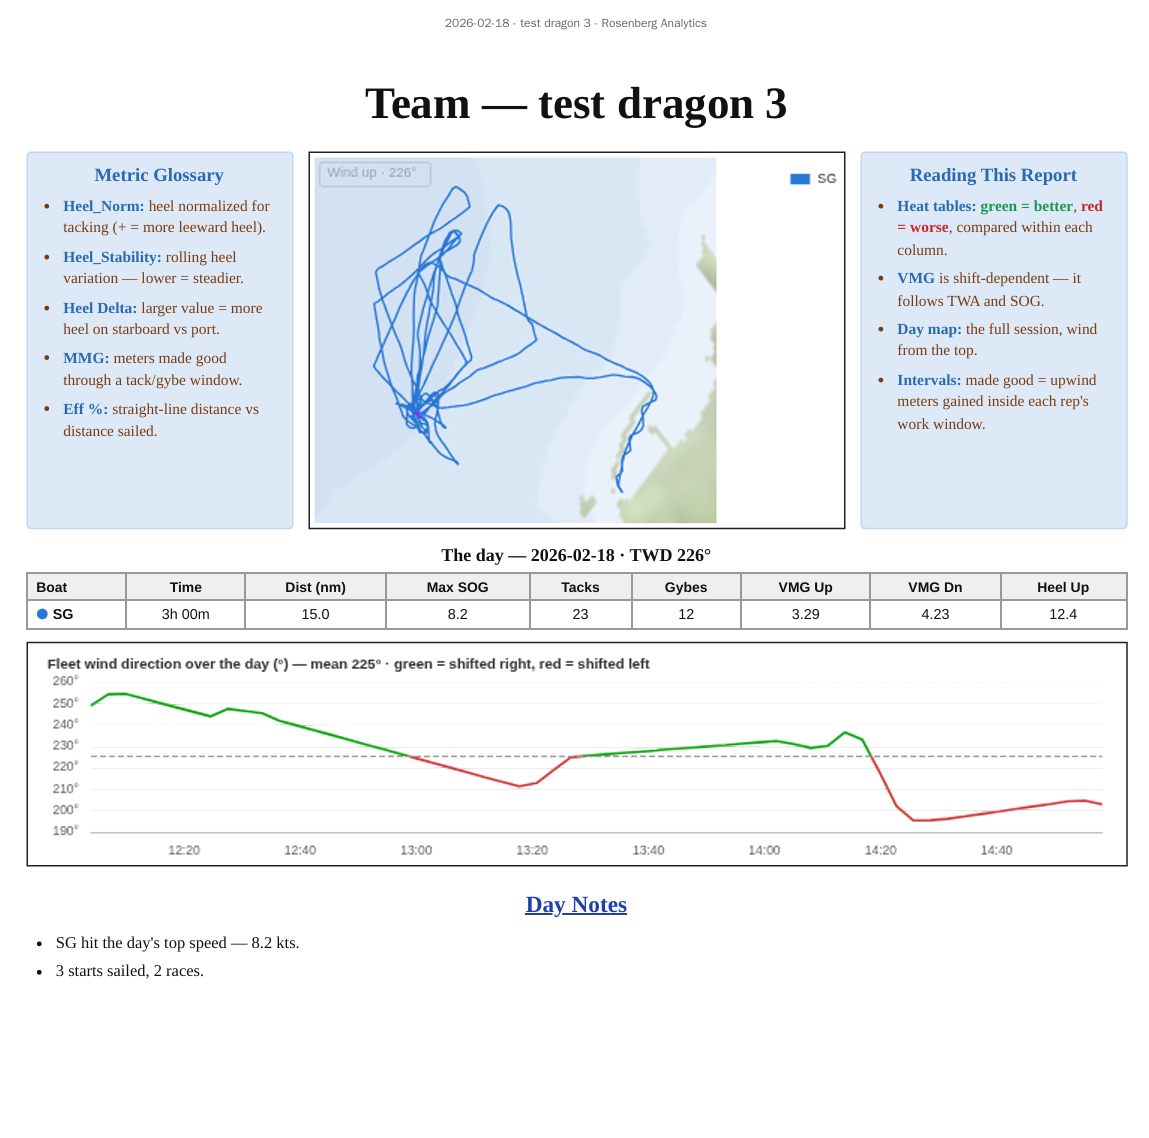
The day: full track map, distance sailed, top speed, tacks and gybes, VMG upwind and downwind, and how the wind shifted through the session
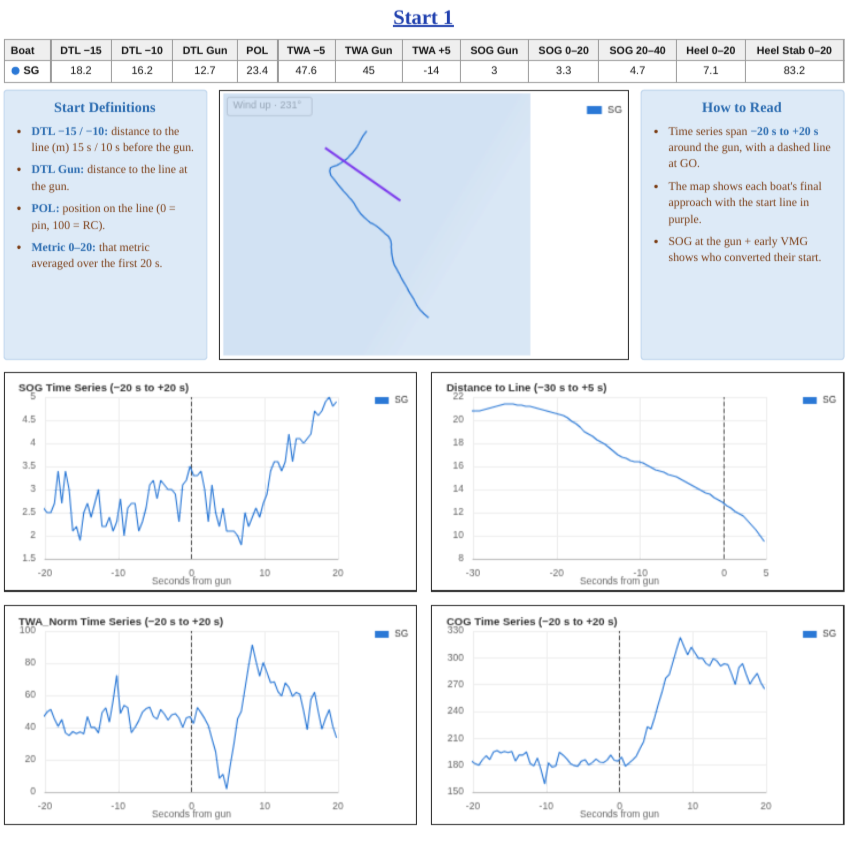
Starts: distance to the line at 15 and 10 seconds and at the gun, position on the line, and speed and angle through the start, for every start
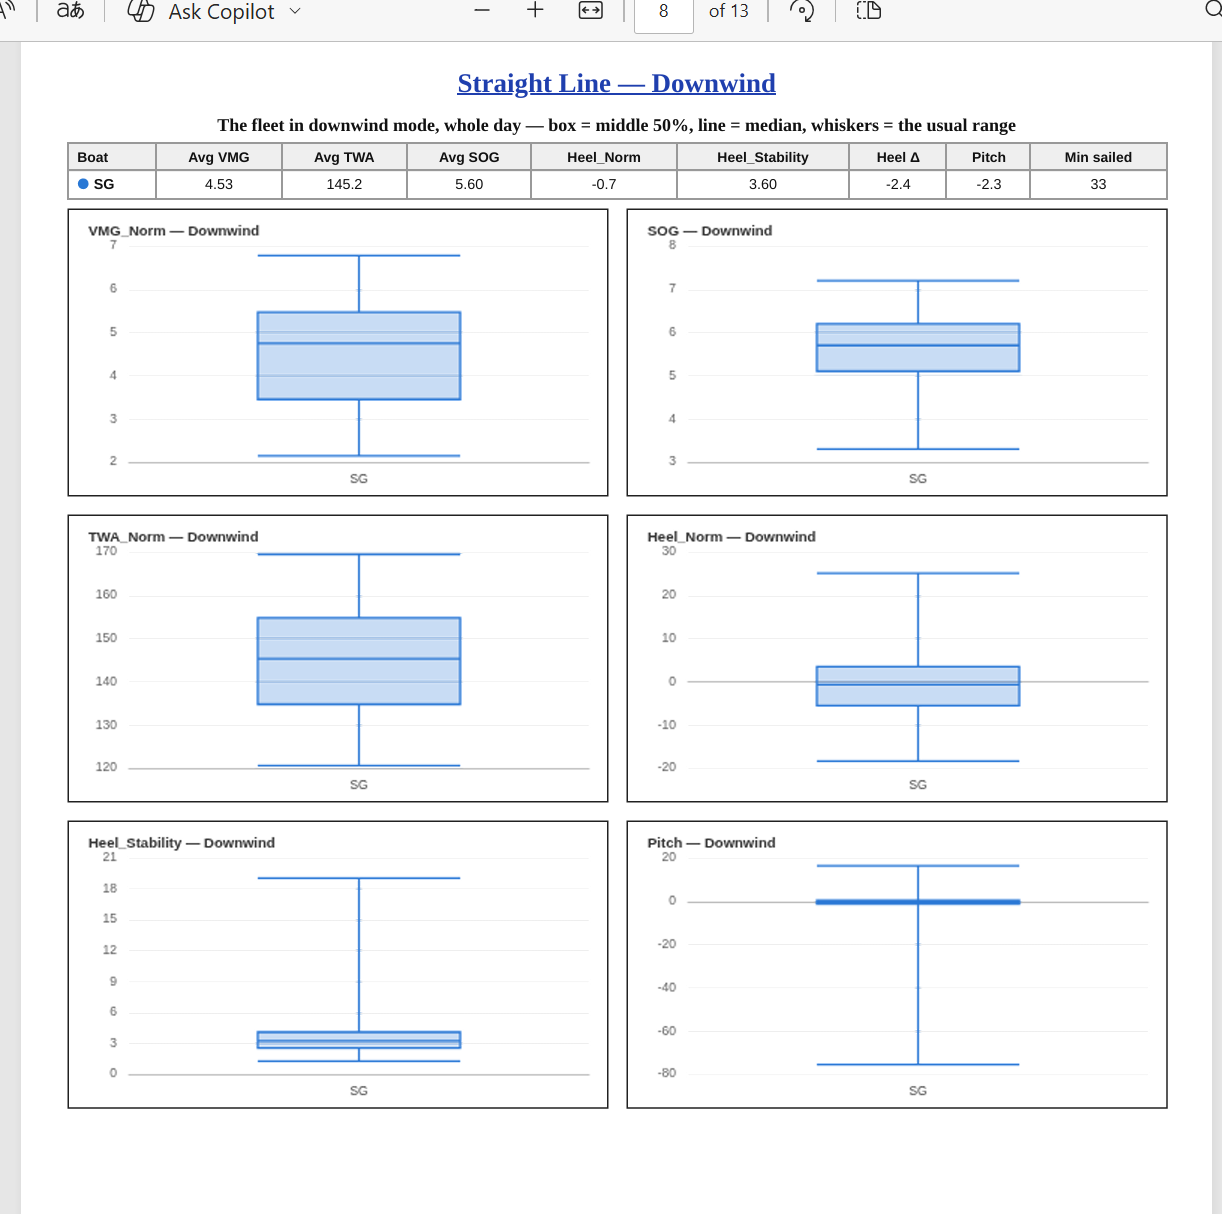
Straight-line speed: upwind, reaching and downwind modes compared for VMG, boat speed, wind angle, heel and pitch
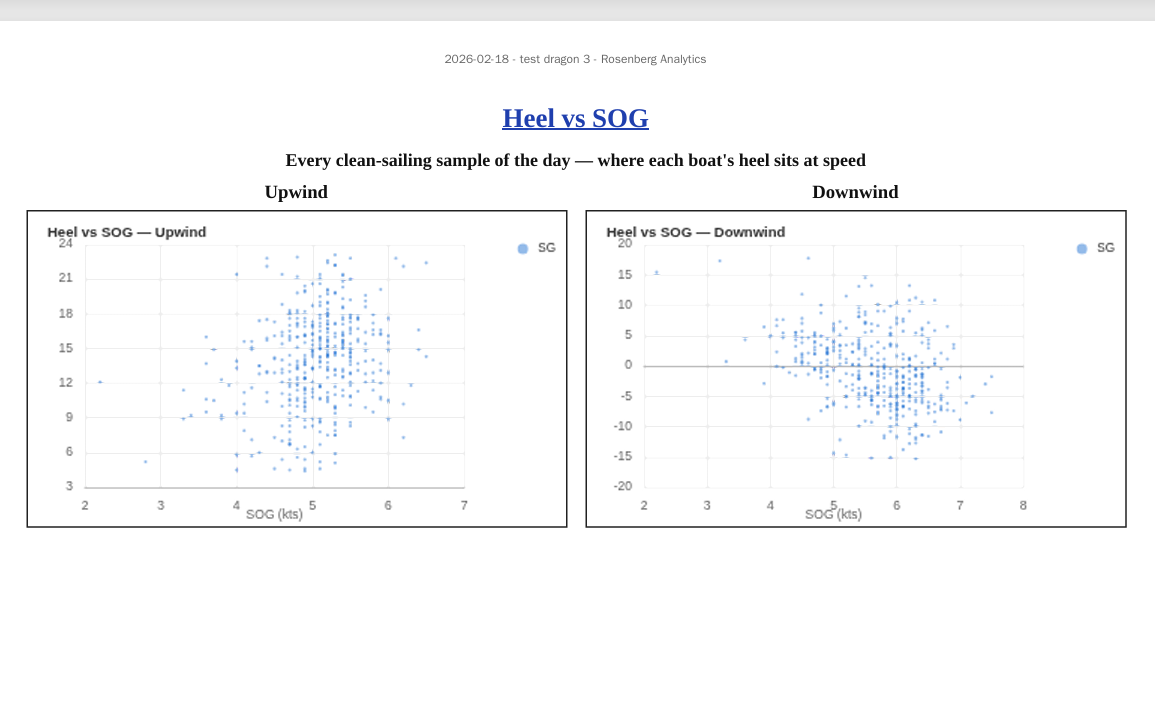
Heel vs speed: where the boat sits at its fastest, upwind and downwind
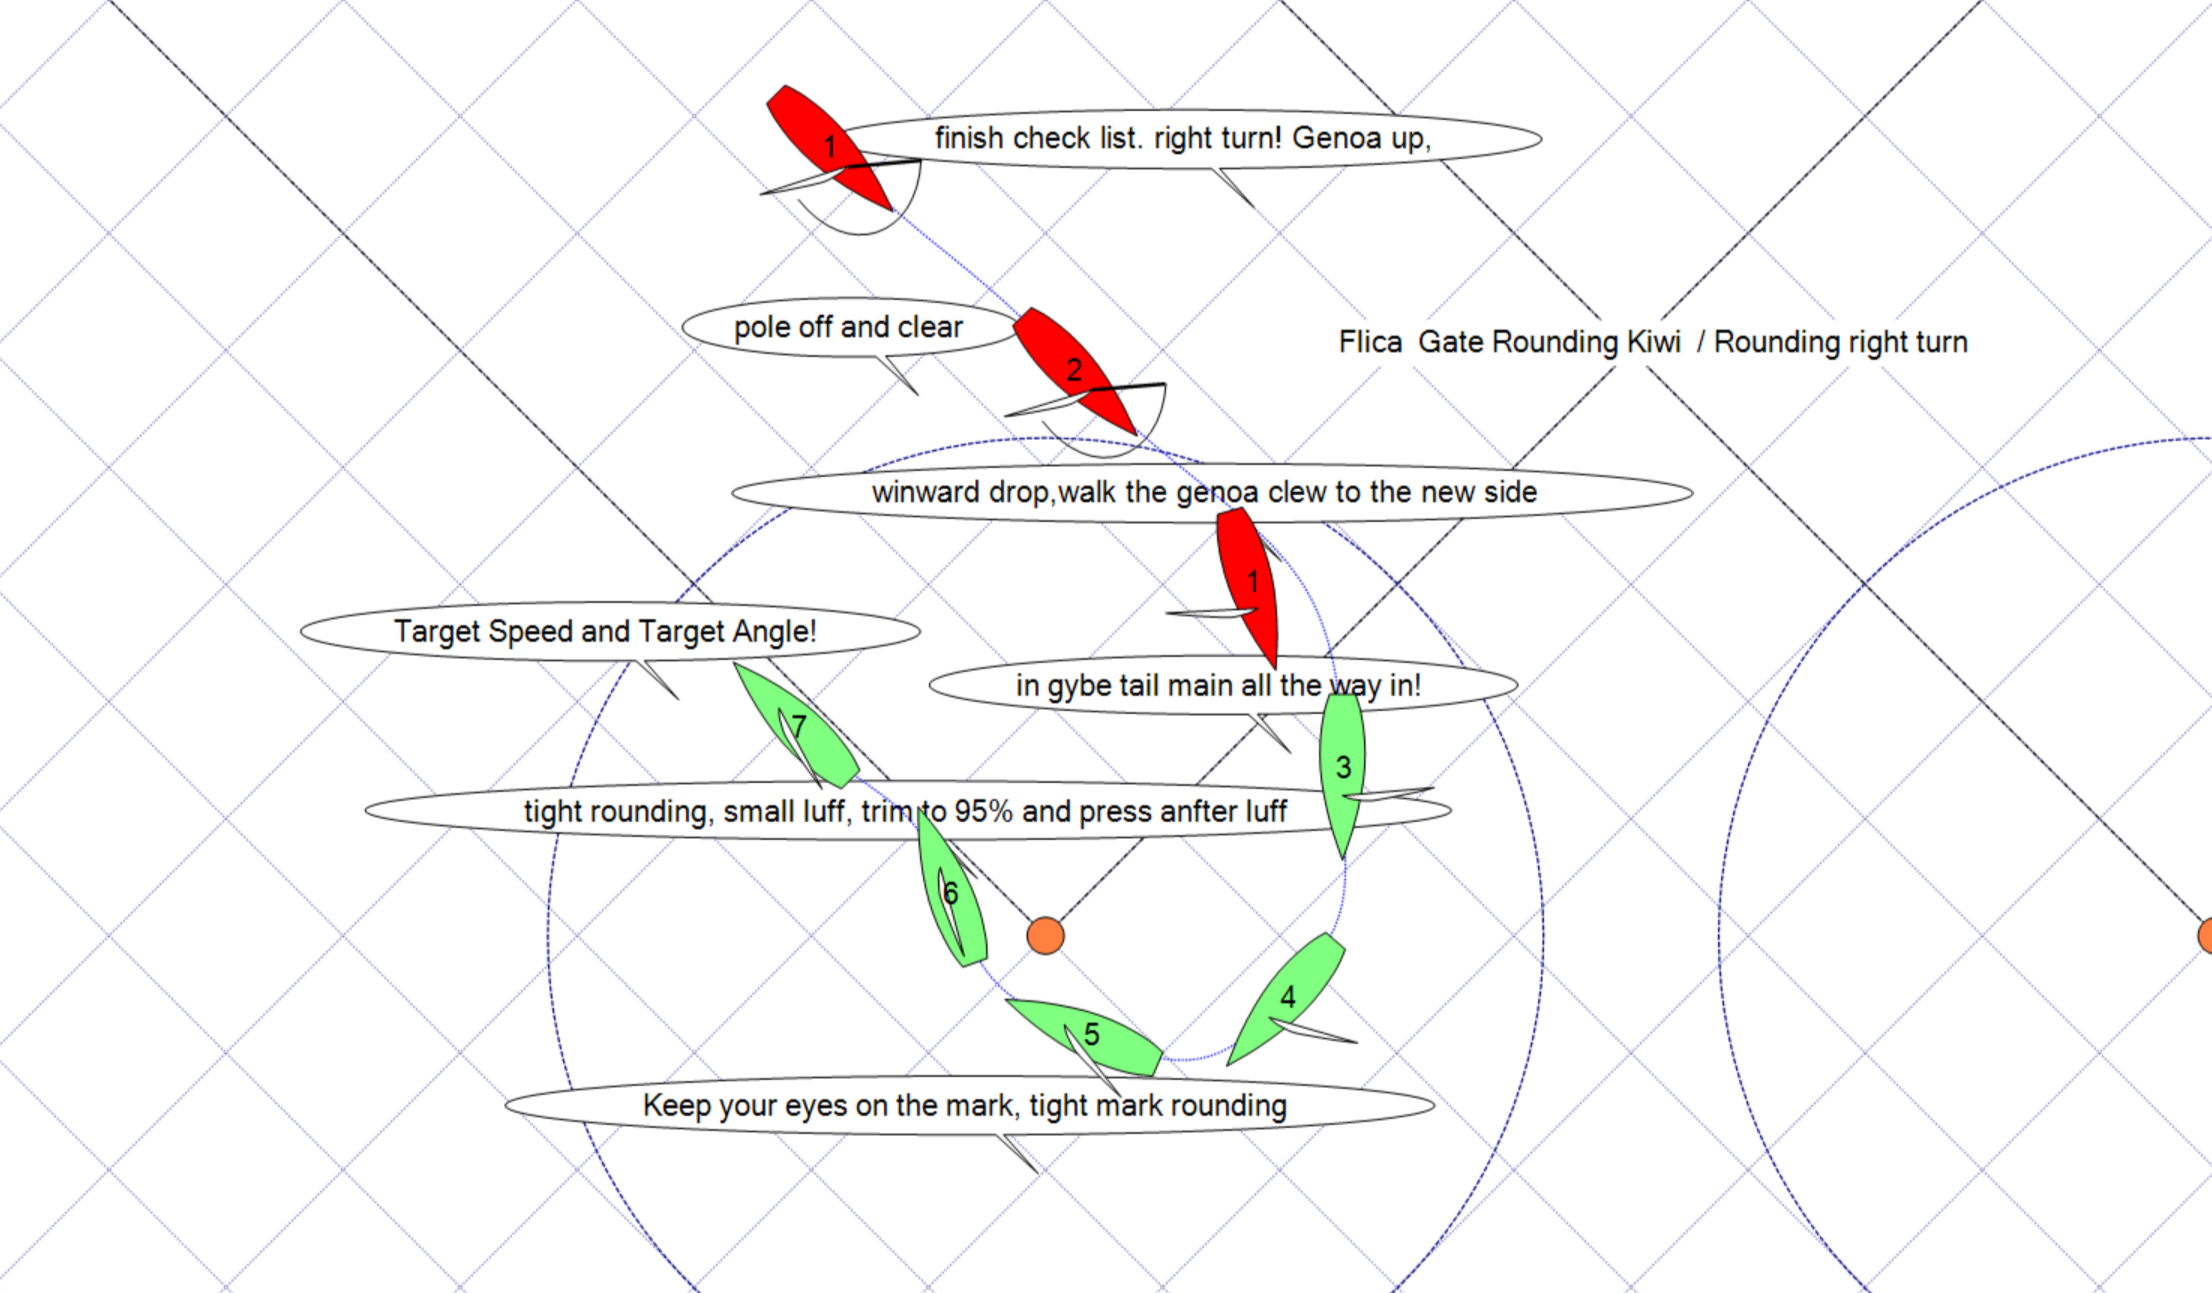
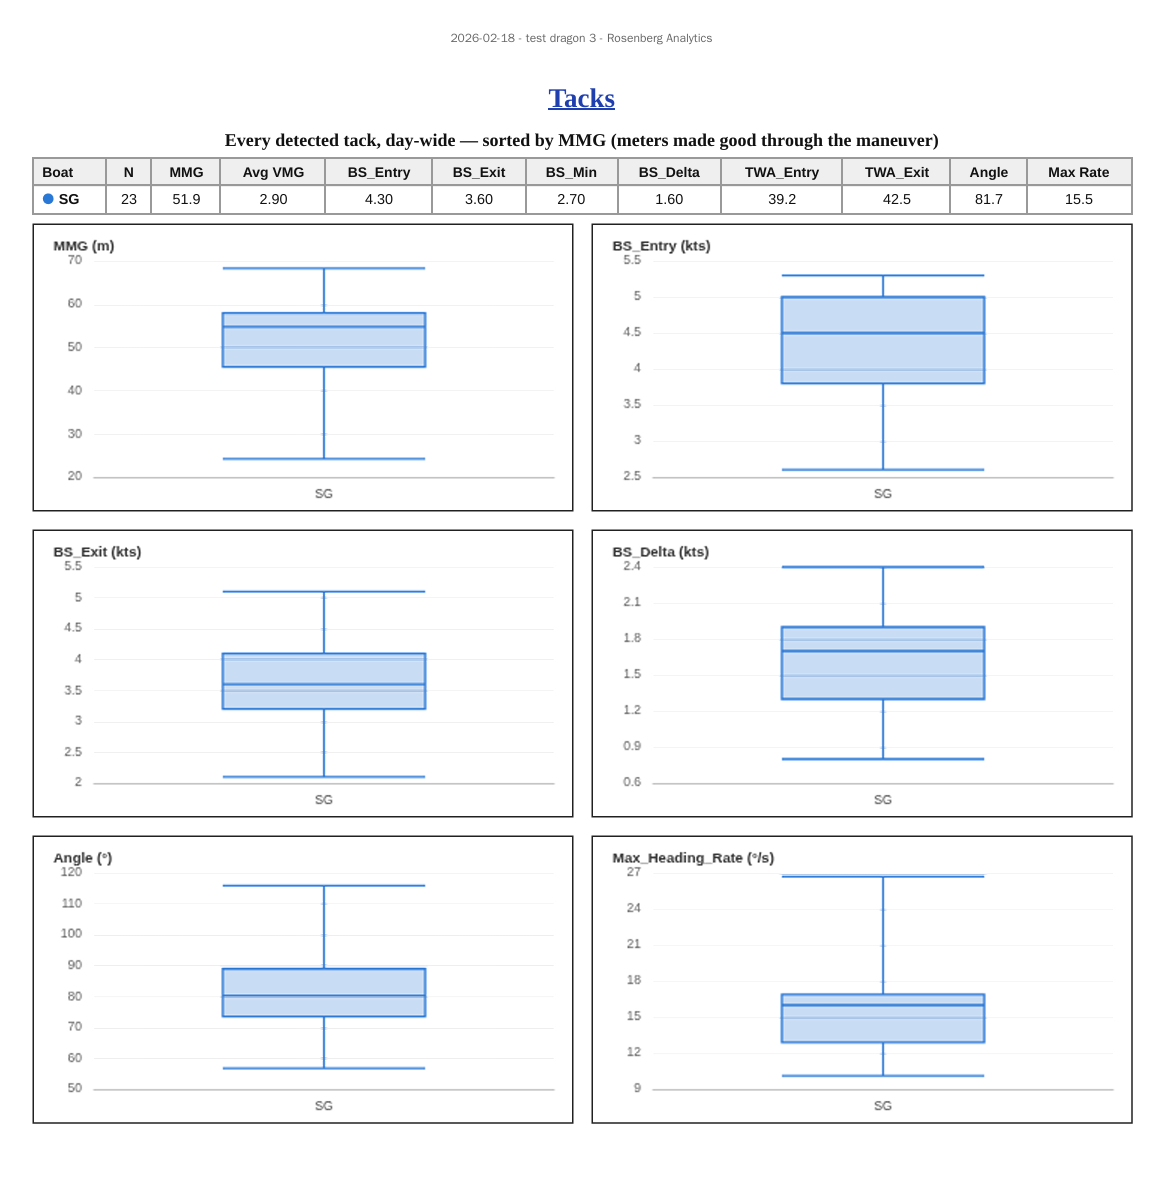
Manoeuvres: every tack and gybe measured for metres made good, speed lost, entry and exit angles and turn rate
Combined with drone footage and on-water coaching, the analytics turn each session into a short list of things to work on next. Available for one-design and big-boat programmes. Get in touch to see a sample report.